A “phase” is defined by a specific physical property: state (solid, liquid, gas or plasma), crystallographic structure, magnetic order, electronic response (insulator, metal or superconductor)… A “phase diagram” shows the most thermodynamically stable phases adopted by a material as a function of external conditions – often, pressure and temperature – or alloy composition. We measure and predict phase diagrams under extreme conditions. Experimentally, our favorite tools are laser-heated diamond anvil cells, synchrotron radiation and laser-shock processing – we are thus active users of several large instruments. Theoretically, we perform molecular dynamic simulations using the density functional theory or numerical potentials – we develop several computational codes and take advantage of our large access to supercomputers located nearby.
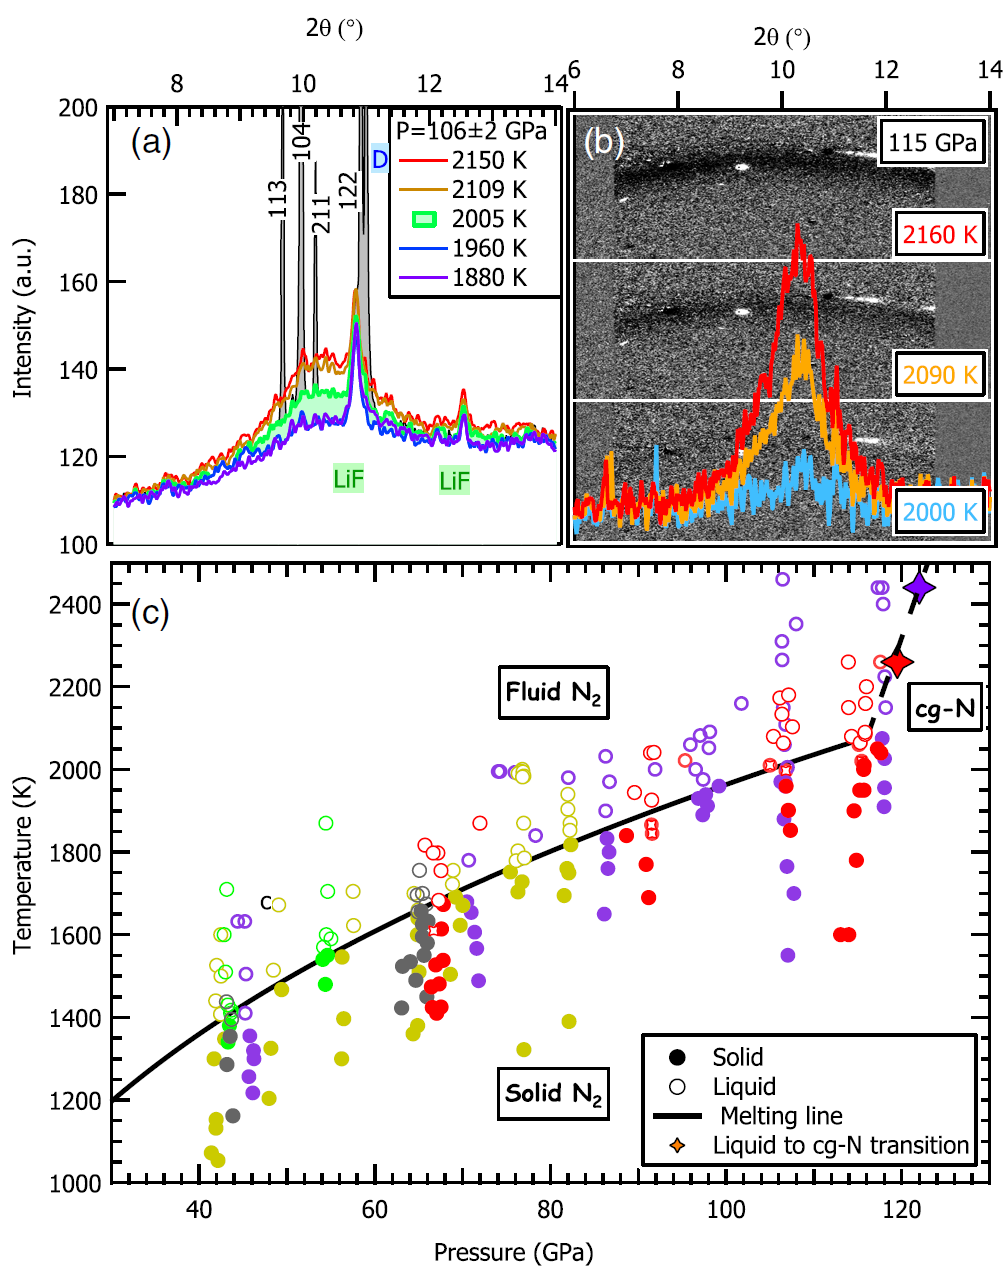
Figure 2:
Determination of the nitrogen melting curve from five experiments. (a) X-ray diffraction patterns collected at several temperatures around melting at 106 GPa. (b) Background-subtracted x-ray diffraction 2D images collected at several temperatures around melting at 115 GPa and the corresponding integrated patterns. (c) Pressure-temperature conditions at which x-ray diffraction patterns have been collected. After Weck et al., Phys. Rev. Lett. 119, 235701, 2017
Publications
- P. Loubeyre, F. Occelli, Paul Dumas, Synchrotron infrared spectroscopic evidence of the probable transition to metal hydrogen, Nature 577, 631–635 (2020) DOI
- V. Riffet, B. Amadon, N. Bruzy, and C. Denoual, Role of dislocations in the bcc-hcp transition under high pressure: A first-principles approach in beryllium, Phys. Rev. Materials 4, 063609 (2020) DOI
- J. Bouchet, F. Bottin, V. Recoules, F. Remus, G. Morard, R.M. Bolis, A. Benuzzi-Mounaix, Ab initio calculations of the B1-B2 phase transition in MgO, Phys. Rev. B 99, 094113 (2019) DOI
- G. Weck, F. Datchi, G. Garbarino, S. Ninet, J.-A. Queyroux, T. Plisson, M. Mezouar, and P. Loubeyre, Melting Curve and Liquid Structure of Nitrogen Probed by X-ray Diffraction to 120 Gpa, Phys. Rev. Lett. 119, 235701 (2017) DOI
- A. Dewaele, V. Stutzmann, J. Bouchet, F. Bottin, F. Occelli, M. Mezouar, High pressure-temperature phase diagram and equation of state of titanium, Phys. Rev. B 91, 134108 (2015) DOI
- C.M. Pépin, A. Dewaele, G. Geneste, P. Loubeyre, and M. Mezouar, New Iron Hydrides under High Pressure, Phys. Rev. Lett. 113, 265504 (2014) DOI
Researchers involved
B. Amadon, R. Béjaud, F. Bottin, N. Bruzy, C. Denoual, A. Dewaele, A. Forestier, F. Gendron, G. Geneste, P. Loubeyre, J.-B. Maillet, P. Lafourcade, F. Occelli, C. Pépin, N. Pineau, V. Recoules, B. Siberchicot, A. Sollier, L. Soulard, L. Toraille M. Torrent, L. Videau, G. Weck